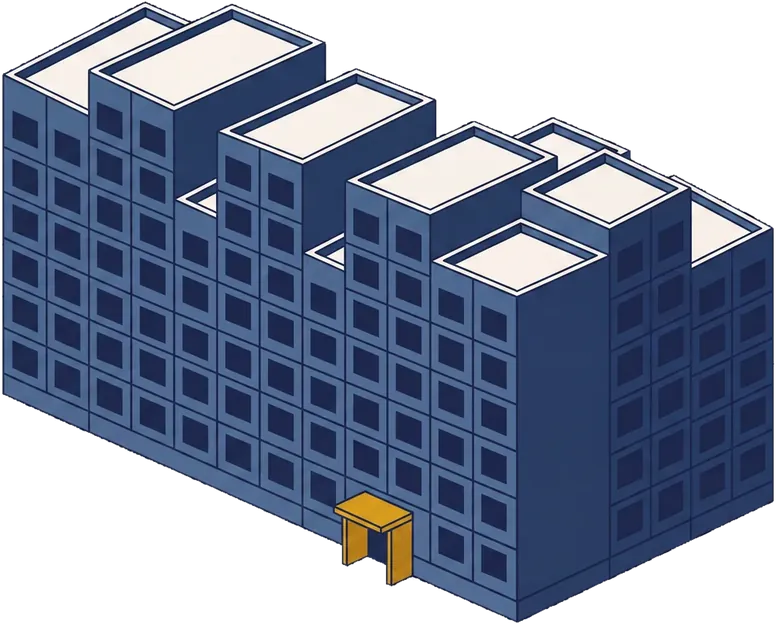
Nine scattered sites. One Manhattan portfolio.
Scatter-site portfolio across nine Manhattan sites; conversion under a project-based voucher HAP contract with strict income and rent restrictions.
Figures are drawn from project records. Names, partners, and addresses are withheld by design.
What was built.
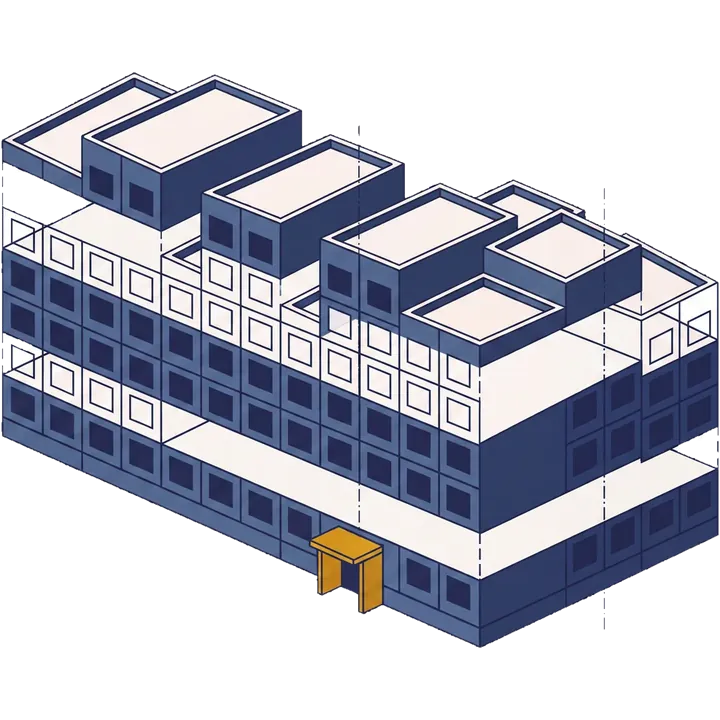
The scope taken apart into the four trades it was bid and run in. Every line of it happened with residents in place, which is the constraint that decides sequence, phasing and cost.
What this one proves .0
Scatter-site costs more per door, and logistics are the reason.
Nine sites means nine of everything — nine mobilisations, nine sets of resident notices, nine superintendents' routines to work around. At $504k a unit against $224k on a campus deal, that difference is not the drawings. It is the walking.
Nine sites, one contract, and every resident in place throughout. Bring us the one you are working through.
Work it throughWork packages .1
9 lines of scope, by trade. 3 enter occupied apartments — marked.
Building systems3
- Elevator modernization
- MEP overhaul — electrical, building-wide Wi-Fi, mechanical and steam systems, bathroom ventilation
- Electrification of heat via heat-pump window units
Envelope3
- Roof replacement and community-center roof repairs
- Full window replacement
- Common-area upgrades and façade repairs
Interiors1
- Kitchen and bathroom upgrades — stainless appliances, quartz counters, new fixtures
Site & amenities2
- Laundry-room build-out and new senior center
- Playground, landscaping and hardscaping
Capital structure .2
Sources behind the $113MM total development cost, in order of repayment priority.
Sources only — amounts are not disclosed.
Chronology .3
46 years old at conversion.
The operator's note .4
On the map. Approximate by design.
Marker height encodes portfolio size, not location precision. Sites are shown by borough because that is as specific as this page gets.
Where this one sits in the portfolio.
The portfolio schedule with this project’s row brought forward. Bars are scaled within each column, so measures of different units never share a scale.
Bring us the deal, the deficiency, or the decisions you're stuck on.
Let's work it through.
Work it throughOne business day to a reply3,500+ units advised & operated25 years in NYC